
Our Compass: Why "Total Money Saved" is Vwala’s North Star
Building in Public #002: Vwala's North Star Metric

If a company’s Mission and Vision define why we exist and where we are going, the North Star Metric (NSM) is a compass that helps us get there.
A NSM is the single, overarching metric that everyone in the company rallies behind. It serves as a leading indicator of two things simultaneously:
the success of the business
the value delivered to the user
It’s the one number that, if it goes up, means we are winning, and importantly, our users are winning too.
What makes a “Good” North Star?
I’d say a strong NSM generally follows four rules:
It’s simple: It should be easy to grasp. If you can’t explain it in 15 seconds, it’s too complex.
It measures progress: It must correlate directly with business growth. If this number stays flat while your revenue grows, you’ve picked the wrong metric.
It reflects customer value: It reinforces your core value proposition. If the metric goes up, the customer’s life should be getting better.
It’s cross-functional: It isn’t just for “Marketing” or “Product.” Every team should be able to see how their work, whether writing code or closing deals, influences this number.
NSM vs. KPIs: a Hierarchy of Metrics
Let’s not confuse the NSM with KPIs (Key Performance Indicators) or Key Results (KRs). The NSM is the “what” and “why”, it’s the bigger picture. KPIs are the “how”: the granular, often team-specific metrics that support the North Star.
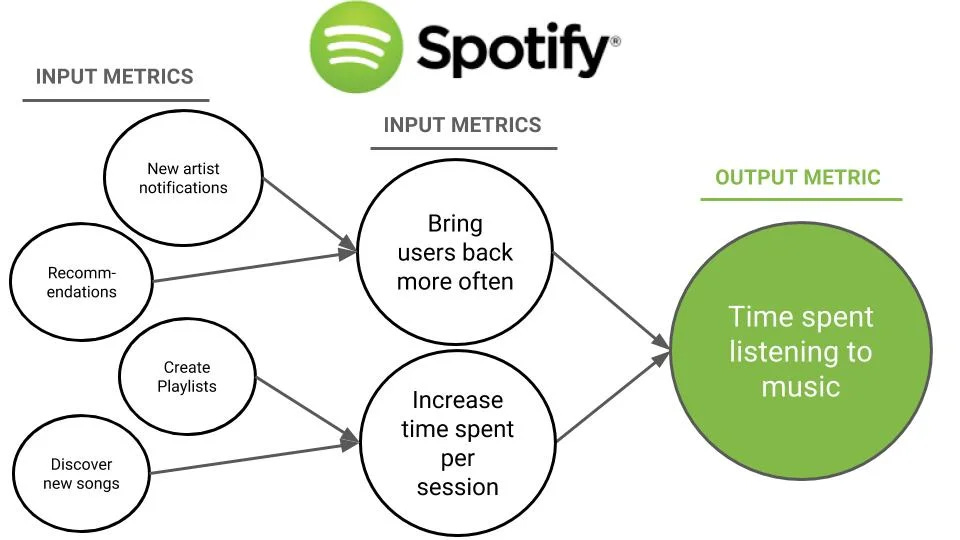
Take Spotify as an example. Their NSM is “Total Time Spent Listening.”
If they focused only on “New Sign-ups” or “User Retention”, they might grow their user base, but if those users don’t listen to music, the business eventually fails. By focusing on listening time, they ensure the product is actually delivering value. If people are listening, they are likely to stay subscribed (revenue) and tell their friends (growth).
Defining Vwala’s NSM
We initially landed on Total Annualized Savings (TAS). While TAS is technically accurate, it felt a bit clinical. To make it more “Spotify-esque” and easier for the team to rally around, we’re phrasing it as: Total Money Saved.
It’s the sum of realized savings attributable to Vwala actions within a defined time window.
Why this works for us:
The ultimate “win”: If this number goes up, it means we successfully put more money back in our users’ pockets.
It predicts retention: A household that saves € 500 a year is much less likely to churn than one that saves € 0. It’s a strong leading indicator of stickiness.
It’s universal: Whether you are in Engineering or Marketing, your work can directly increase the NSM.
It’s flexible: As an early-stage startup, our revenue model and GTM strategy might evolve and pivots can still happen (that’s why you should maximize your rate of learning). However, “Total Money Saved” feels like a flexible NSM that can adapt to these potentially changing situations.
It’s a strategic differentiator: Many personal finance management (PFM) apps focus on insights and tell you where your money went. We want to be actionable. By focusing on “Money Saved,” we shift the focus from passive observation to active improvement.
Operationalizing the metric
A North Star is useless if it just sits on a slide deck. To make it work, you have to bake it into the company DNA.
A forcing device to help guide decisions
When deciding which solutions to build, ask: “Will this increase the Total Money Saved more than the alternative?” If a solution looks “cool” but doesn’t move the needle on savings, it moves to the bottom of the backlog.
Measure it
Defining a metric is easy; measuring it accurately is the hard part. By committing to a measurable NSM, you are also committing to building the technical visibility needed to prove you are actually delivering value. If the team doesn’t trust the math, they won’t follow the metric.
Make it front and center
Review the metric regularly, like at least every two weeks. If it’s stagnant, figure out why and act. Also ensure everyone in the company has access to a live dashboard. When a user saves money, the team should see that reflected in the North Star in real-time.
To make sure “Total Money Saved” stays top-of-mind, we’ve implemented two practical tools:
A weekly Slack pulse: We built a simple AI workflow that posts our NSM directly into a public Slack channel every week. It doesn’t just drop a number; it provides a brief analysis of the trend, highlighting whether we are up or down and why.
A Looker Dashboard: We have a Looker dashboard that is open to everyone. It also allows any team member to “slice and dice” the North Star, e.g. breaking it down by user segments, cohorts, etc. By making the data transparent, we empower everyone to investigate exactly how their work is moving the needle.